
Estimating Solar Energy
There are numerous tools available to homeowners, installers and developers to estimate the amount of energy a PV system will generate. These tools range from simple free online tools to complicated extraordinarily expensive modeling software packages. Those of you looking for a free tool that provides good preliminary or checksum data, turn to the National Renewable Energy Laboratory’s (NREL) PVWatts Calculator (found here). Of all the tools available online, this is quite simply the easiest to use as well as provides meaningful production output data. Below, we will walk through using the tool to estimate your dream solar system or maybe check on the past couple of month’s production of your recently installed dream solar system. Either way, this tool can help you understand what to expect from the PV system you oh, so desire or finally have.
Below, I present a quick walkthrough of the tool. This is not an in-depth tuto rial nor is it meant to provide you with an all-encompassing exploration of the PVWatts Calculator. Instead, this walkthrough is presented to show how quickly a simple PV system can be modeled when a very basic set of parameters are known. The parameters include location, DC system size and array orientation. Other, more detailed parameters can be input into the calculator, however these are not necessary to develop a basic, yet useful set of expected production values. That said, let’s get started.
When you arrive at the PVWatts website, you are greeted with a simple “Get Started:” field that requests, “Enter a Home or Business Address” as seen in FIgure 1 below. The quickest search criteria to enter is a zip code. Do so and select the “Go” button to the right of the entry field.

Figure 1 - PVWatts Calculator "Get Started"
The next screen that pops up is one where you will choose weather data for your location. The weather data is used on the backend of the PVWatts Calculator to generate location-specific production estimates taking into account climate and meteorological data. Choose a location closest to your home / installation site and select the “Go to system info” arrow at the right of the screen.
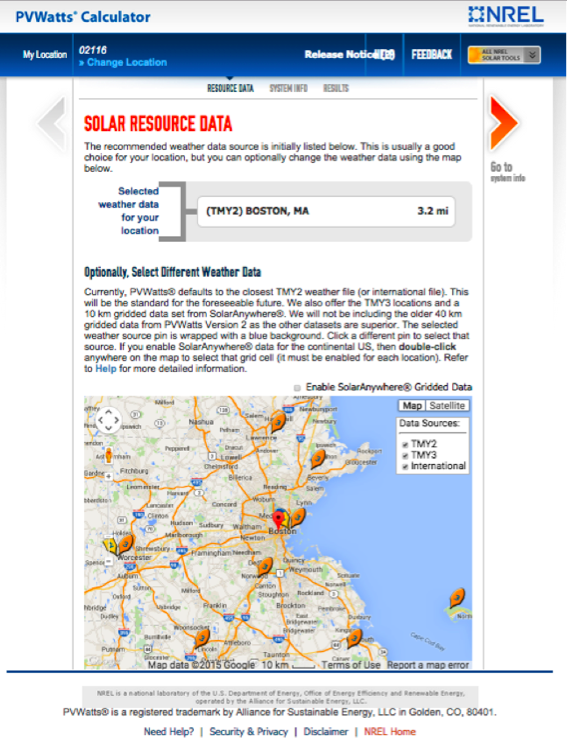
Figure 2 - Solar Resource Data
The System Info screen, see Figure 3, is where you will enter basic details about the PV system you are dreaming about or already have. Descriptions of each of the fields you will be filling out are presented below. If you require additional information about any one field, click on the ‘information’ icon to the right of a field notated with the symbol, “i.”
DC System Size (kW)
- The DC system size is the size of the PV array you would like to know production estimates of. The easiest method of determining your system size is to multiply the number of modules you expect to install by the STC wattage rating of the module and divide by 1,000 to get the kW rating of the array. For example, if you’re planning to install an array of ten 300W solar modules, the DC system size would be 3kW (10*300/1000).
Module Type:
- You have an option of Standard, Premium or Thin Film. Standard is for modules 15% efficient, Premium 19% efficient and Thin Film 10% efficient. Additional information about each of these types of modules can be found in the “i” icon next to the input field. Most applications will use Standard modules.
Array Type:
- Fixed (open rack): any type of tilted rack either ground or roof
- Fixed (roof mount): flush mount roof rack
- 1-Axis Tracking
- 1-Axis Backtracking
- Dual-Axis Tracking
System Losses (%)
- For simplicity, we will keep this at 14%. You are able to define your own system losses for Soiling, Shading, Snow, Mismatch, Wiring, Connections, Light-Induced Degradation, Nameplate Rating, Age and Availability using the Calculator.
TIlt (deg):
- Enter the tilt of the array
Azimuth (deg):
- Enter the azimuth of the array
Advanced Parameters
- DC to AC Size Ratio
- Default 1.1 (the DC system size is 110% of the Inverter’s output rating in watts)
Inverter Efficiency
- Default: 96%
Ground Coverage Ratio
- Default: .4
A basic economic analysis can be performed by entering information into the fields under the “Initial Economics (Optional)” section. For purposes of simply understanding how much solar energy can be expected from the desired system we are not going to review the economics at this time.
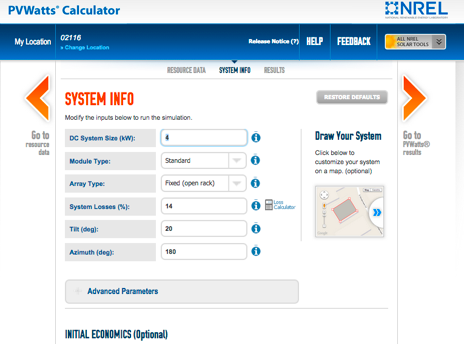
Figure 3 - System Info
The results of the next screen, see Figure 4, present the estimated amount of solar energy expected from the system you defined in the previous step. These values are presented in the AC Energy (kWh) column. The results can be downloaded in CSV format in two data set options, Monthly and Daily. For the purposes outlined here, the Monthly data set will suffice. Select the Monthly link under the results table to get a copy of the results.

Figure 4 - Results
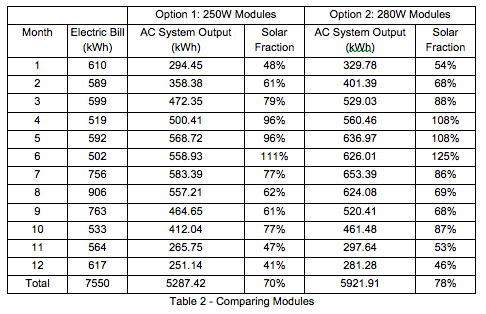
For those of you dreaming up a system, the AC Energy (kWh) values are what you’d expect on a monthly basis for solar energy production should you install a PV system. Compare the monthly AC production values to your monthly electric bills to get a sense of what your solar fraction (solar production / monthly electric bill) would be. Table 1 below shows how to setup a spreadsheet to quickly calculate monthly and overall solar fraction values. A simple modification of the Monthly data set downloaded from the Results page was used to create this table. Two additional columns, Electric Bill and Solar Fraction were added to calculate the solar fraction. The Solar Fraction is calculated simply by dividing the AC System Output by Electric Bill for each month and the overall year.
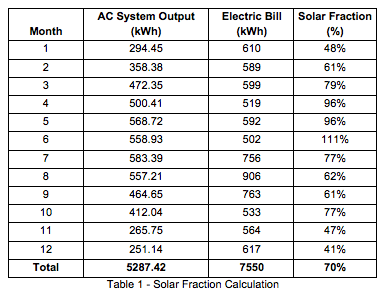
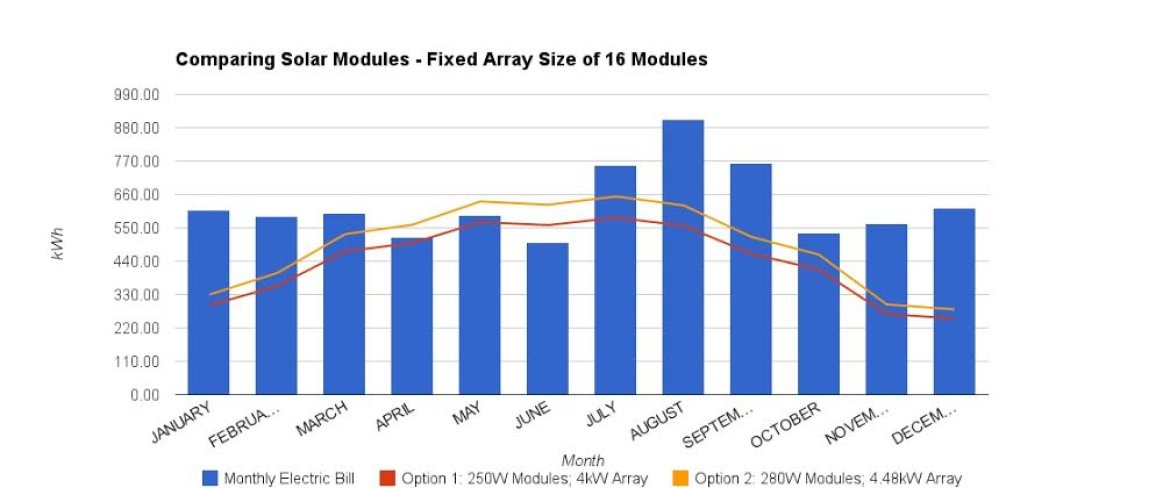
If you’re really interested in getting into data and really want to assess what the best solar module size would be for your dream system, you can modify the above table to include different module size options. To do so, create two or three AC System Output columns, each with a label that describes what the option would be. For instance, the values in Table 1 are based upon a DC System Size of 4kW. This 4kW is comprised of 16 250W solar modules. What if you wanted to compare the output of 280W modules? You would redefine the DC System Size in the System Info page as 4.48kW and run the calculation again. Download the new results and place them in a modified table, such as Table 2 below. This is a great method to compare different array capacities (array DC STC in kW) for a specific array size (number of modules).
For those of you who already own a dream PV system, you can use the expected AC Energy (kWh) column to compare with the monthly solar production your system has recently produced. You should expect the two sets of data to be similar. If there are large discrepancies, more than 15% difference between what is expected and what was produced, a more in-depth assessment would be required. Obvious reasons for the data sets to have large discrepancies mostly include weather and less frequently, frequent or long-term power outages.
For example, if your climate experiences frequent snowfalls, your solar panels may be covered for long durations of time resulting in less energy production than expected. When frequent or long-term power outages occur, especially when solar radiation is higher, the expected production will be much greater than actual production because your grid-tied PV system is not producing energy when the utility is down. It is important to note, that the data presented in the Results page of the PVWatts Calculator are estimates and are based upon the information you enter into the System Information page. Therefore, be cautious when comparing real data to the estimated data and try to consider all relevant criteria, such as recent weather before concluding that something might be wrong with your system. Most systems equipped with monitoring will send notices to you, the owner, and the installer if something is wrong with the system. If you believe something is wrong, contact your installer and provide them with the data you just compiled to aid in their troubleshooting of your system.
That’s it. Estimating solar production is a very simple task using the free and powerful tool, PVWatts Calculator provided by NREL. Enter your location, system size and basic system info, click “Get Results” and there you have it a basic, but very useful summary of what you can expect from a PV system at a specific location. The downloadable data sets allow for an even further in-depth analysis. However, for simple, quick, insightful data the basic results will suffice should you want to know whether or not the 280W module would be a better fit.