The proliferation of residential and commercial photovoltaic (PV) energy systems is causing increased concern among the nation’s utilities that PV may upset the traditional centralized generation model that has existed since the commercialization of electricity. Through net metering, utility customers are able to drastically reduce or even entirely offset their electric bills using increasingly affordable PV systems. As more utility customers choose to install PV systems, utility revenue may decrease, and fewer customers will share the divided costs of grid operation and maintenance.
As the cost of a PV system plummets, the number of PV systems increase. Since 2008 the cost of a PV module has decreased by 80%. In 2013, 30 percent more PV systems will be installed than in 2012. A 2010 World Energy Council report predicts that in 2100, 70 percent of world energy production may come from solar energy (World Energy Council, 2010). The rapid increase in solar energy deployment threatens electric utilities’ reliance on centralized fossil fuel power plants.
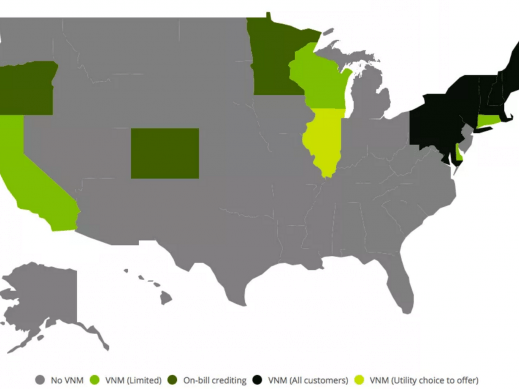
In grid-connected PV systems, excess power is provided to the grid in a process known as net metering. In net-metered systems, utilities are required to credit the PV system owner for surplus generation the PV system feeds into the grid. The credit is applied against the power the customer consumes from the grid when the PV system is unable to meet the customer’s electrical demand. Utility customers pay only for the “net” power they consume from the utility. As a result of net metering, it is possible for a utility customer to consume grid power while paying the utility little to nothing. Under the Energy Policy Act of 2005, all public utilities are required by law to provide net metering to customers upon request (SEIA, 2013). Currently net metering policies are active in 43 states.
As utility power rates continue to increase and the cost of PV systems continues to decrease, the cost of PV will eventually equal the cost of grid power, and even become less expensive. Utilities rely on a top-down business model where power is produced at few, large, centralized power plants and dispersed to grid customers. This traditional model is under threat as the feasibility of power production from numerous distributed PV systems increases and awareness of the fragility and outdated nature of our existing distribution network is exposed by natural disasters like hurricane Sandy and Sparky the Squirrel. Richard Caperton of the Center for American Progress outlines a worst-case scenario he calls the “Utility Death Spiral” in which a feedback loop is established where as more customers install PV, the cost of being grid connected increases, encouraging more ratepayers to leave the grid (Caperton, 2013). The Hawaii Electric Company (HECO) is currently experiencing this phenomenon. Peak energy use in Hawaii occurred in 2004 and has been decreasing since then while the number of PV installations has doubled every 2 years (Maui Tomorrow).
We are not yet experiencing a real shift in power generation, in fact, solar is still a tiny part of our (US) power source at about .1% of the mix*. However, the writing is on the wall for US utilities and they are well aware of the deep penetration solar has had on some other grids (see: Germany) It isn’t that utilities are ‘evil’ - in fact if you were to ask any one employee of almost any utility what they thought of solar, their response would almost certainly be positive. The utilities whose company culture can keep pace with the ideals of their individuals (and match the expansion of distributed generation) are well suited to participate in the evolving grid through transmission and distribution management. The organizations which can’t respond will most likely suffer the same fate as the record labels that ignored the growth of the Web.
_________
* What is the U.S. electricity generation by energy source?
In 2012, the United States generated about 4,054 billion kilowatthours of electricity. About 68% of the electricity generated was from fossil fuel (coal, natural gas, and petroleum), with 37% attributed from coal.
Energy sources and percent share of total electricity generation in 2012 were:
-
Coal 37%
-
Natural Gas 30%
-
Nuclear 19%
-
Hydropower 7%
-
Other Renewable 5%
-
Biomass 1.42%
-
Geothermal 0.41%
-
Solar 0.11%
-
Wind 3.46%
-
-
Petroleum 1%
Other Gases < 1%
Source: U.S. Energy Information Administration.
www.eia.gov/tools/faqs/faq.cfm?id=427&t=3


